Template Simple
This template shows how to simulate a simple vehicle and plot the results.
First, we choose the tire and vehicle models. The first one is the Pacejka tire model (Pacejka (Magic Formula)) and the second one is the nonlinear vehicle model (Simple vehicle 3 DOF).
TireModel = TirePacejka();                  % Choosing tire
VehicleModel = VehicleSimpleNonlinear();    % Choosing vehicle
In this case, no parameter is defined. So, the default values are used. The default parameters of the vehicle and tire model can be seen in VehicleSimpleNonlinear and TirePacejka, respectively.
Now, we have two variables defined.
The system is completely defined once we attribute the chosen tire model to the vehicle object.
VehicleModel.tire = TireModel;
After this, we define the simulation time span
T = 6;                              % Total simulation time [s]
resol = 50;                         % Resolution
TSPAN = 0:T/resol:T;                % Time span [s]
To define a simulation object (Simulator) the arguments must be the vehicle object and the time span. This is,
simulator = Simulator(VehicleModel, TSPAN);
The default parameters of the simulation object can be found in Simulator. However, we are interested in changing the initial conditions of the simulation object. This can be done running
simulator.ALPHAT0 = -0.2;           % Initial side slip angle [rad]
simulator.dPSI0 = 0.7;              % Initial yaw rate [rad/s]
Now, we have everything needed to run the simulation. For this, we use
simulator.Simulate();
The resulting time response of each state is stored in separate variables:
XT = simulator.XT;
YT = simulator.YT;
PSI = simulator.PSI;
VEL = simulator.VEL;
ALPHAT = simulator.ALPHAT;
dPSI = simulator.dPSI;
The following lines plot the time response of each state of the model.
f1 = figure(1);
grid on ; box on
plot(TSPAN,XT,'linewidth',1)
xlabel('time [s]')
ylabel('Distance in the x direction [m]')

f2 = figure(2);
grid on ; box on
plot(TSPAN,YT,'linewidth',1)
xlabel('time [s]')
ylabel('Distance in the y direction [m]')

f3 = figure(3);
grid on ; box on
plot(TSPAN,PSI,'linewidth',1)
xlabel('time [s]')
ylabel('Yaw angle [rad]')

f4 = figure(4);
grid on ; box on
plot(TSPAN,VEL,'linewidth',1)
xlabel('time [s]')
ylabel('Velocity [m/s]')

f5 = figure(5);
grid on ; box on
plot(TSPAN,ALPHAT,'linewidth',1)
xlabel('time [s]')
ylabel('Vehicle slip angle [rad/s]')

f6 = figure(6);
grid on ; box on
plot(TSPAN,dPSI,'linewidth',1)
xlabel('time [s]')
ylabel('Yaw rate [rad/s]')
The generated figures can be seen below.

Fig. 51 Longitudinal position of the center of gravity of the system.

Fig. 52 Transversal position of the center of gravity of the system.

Fig. 53 Yaw angle of the vehicle

Fig. 54 Velocity of the center of gravity

Fig. 55 Vehicle slip angle

Fig. 56 Vehicle yaw rate
Frame and animation can be generated defining a graphic object (Graphics). The only argument of the graphic object is the simulator object after the simulation.
g = Graphics(simulator);
After that, just run
g.Frame();
g.Animation();
Both graphics feature can be seen below.

Fig. 57 Frame of the simple vehicle model.
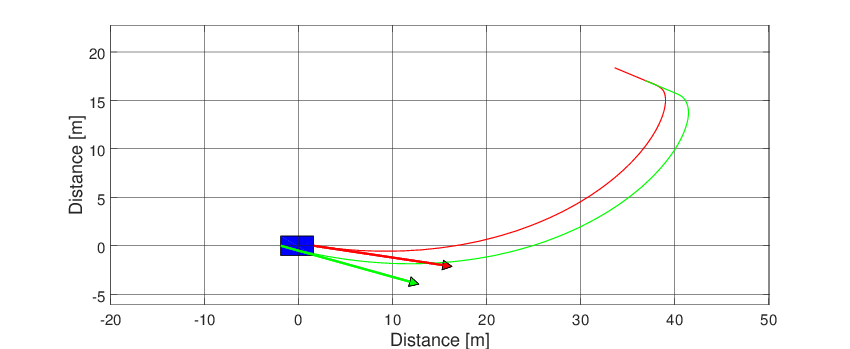
Fig. 58 Animation of the simple vehicle model.